Nina Walat/Daily Collegian
How weird was A-10 basketball in the COVID season?
A statistical comparison between this year in the A-10 and years past
April 30, 2021
The squeaks of sneakers echoed throughout Robbins Arena on Feb. 23. The empty seats reverberated the sound of bouncing basketballs. The Massachusetts men’s basketball team was warming up for a matchup against Richmond—its first game in more than two weeks.
The environment featured all the hallmarks of the 2020-21, pandemic-altered season. There were no fans in attendance, benches sat staggered for social distancing and coaches and game operations staff wore masks. The game couldn’t have looked more different than a game played 12 months prior; that is apart from one thing: the product on the court.
UMass came into the contest nine-point underdogs according to the online sportsbook Odds Shark.
“There’s a lot of unknowns,” Minutemen coach Matt McCall said of coming off of pauses. “How does your team respond when the first five guys are put out there to start the game?”
While all the circumstances surrounding the game should’ve made for an unpredictable outcome, the February evening game was anything but.
The Minutemen kept the game within striking distance, trailing by as few as seven deep into the second half, but when the final buzzer sounded, the scoreboard read Richmond: 79, UMass: 65. The 14-point loss wasn’t what UMass hoped for, but it also wasn’t far off by the general expectation of the game, as reflected by the spread.
In fact, the Daily Collegian examined nearly 1,400 games involving Atlantic 10 teams over the past five seasons, and the data suggests that the 2020-21 men’s basketball season, despite all its quirks and unpredictable nature of scheduling, was not all that more unpredictable than years past.
***
Description of Methods:
The Collegian sourced the data from Odds Shark to conduct analysis, scraping results from each Atlantic 10 game this season. Odds Shark provided betting lines for each conference game and for most out of conference games from the 2016-17 season through the 2020-21 season, meaning there were five years’ worth of data points to analyze.
Taking this data, the Collegian created a thorough Excel workbook that accumulated each team’s results over the past five years and split them by season. Then, the results from each season were compiled into a single sheet, carefully removing duplicates to create a comprehensive five-year, 1356 entry sheet of all games played by Atlantic 10 teams since the start of the 2016-17 season.
To clean the data further, any games that did not have a spread given were removed. These were mostly games played against lesser schools in lower Divisions. Columns were also mutated and added to the data set to help in the analysis including:
- “season” column to track which of the five consecutive seasons a game occurred in
- “favored team” column to track which of the teams was favored based on the given spread
- “favored result” binary variable to denote if the favored team’s result occurred or not
- “winning and losing score” columns, splitting the score column into two columns
- “score differential” to see the difference between the scores and compare to spread
- “value from spread” and “absolute value from spread” used as measurements to see how much the score differential varied from the spread of each game.
The “absolute value from spread” was the main metric to see if the expected outcomes of each game varied much after each pause. Since Odds Shark betting lines are created by professional oddsmakers, this is essentially a comparison of how much the outcome differed from the predicted spread/outcome in odds-making models. The Collegian used the mean and median of this metric to compare previous seasons to the COVID-plagued 2020-21 year to see if there was a major variation in the accuracy of betting lines and therefore a variation in expected outcomes.
Other metrics used and analyzed were the winning percentage of favored teams and the deviation of team standings from preseason poll ranks to the end of season outcome. Overall, a mix of Excel (including data mining methods), Google Sheets and Tableau were utilized.
***
In past seasons, with full crowds and no masks, the data shows that oddsmakers were far from perfect. College basketball, after all, is a hit-or-miss sport to project. Maryland Baltimore County overcame all the odds in the 2018 NCAA Tournament, upsetting the No. 1 seed Virginia in the first round.
On average, the data shows that the spreads of A-10 basketball games were off by between 8.27 and 8.91 in the four seasons from 2016-17 to 2019-20. That meant games that experts thought would be close one or two possession games, would routinely play out as double-digit blowouts or even swing the other way, seeing the underdog walk away with a victory.
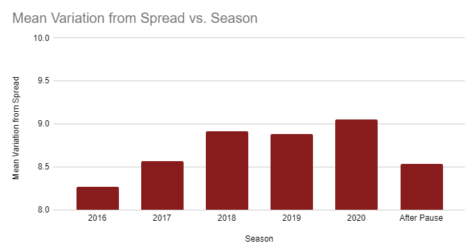
Compare that to the 2020-21 season and the numbers do not tell much of a different story. The absolute value from the spread in the COVID-plagued season was 9.05 points on average, the highest of all the seasons, but only by fractions of a point, not nearly enough to suggest it was significant.
Even looking at median for the same stat–absolute value from the spread–in an effort to remove any outliers from the data, a similar pattern remains. 2020-21 wasn’t even the highest on record, in fact, the median 6.5-point difference from the spread was the exact same as 2016-17, a year where a pandemic seemed something out of a science fiction movie.
One part of the pandemic-altered season that did have a notable impact was health and safety related pauses.
This difference showed up most notably when looking at the win percentage of favored teams. In other words, how often a team won when oddsmakers thought they would.
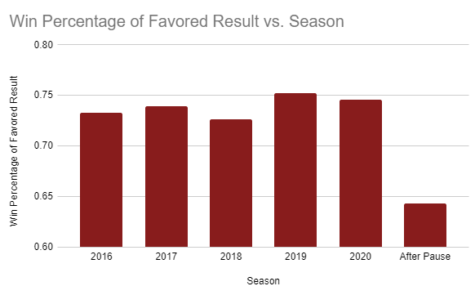
Overall, 2020-21 fit right in line with other seasons according to this metric. Favored teams won at a clip of between 72.6 percent and 75.2 percent of the time over the first four years of the dataset, with 2020-21 right in the middle at 74.5 win percentage for favored teams.
However, when a team came off of a pause–classified as a break of 10 or more days–the winning percentage of favored teams dropped all the way to 64.2 percent, nearly 10 percent lower than a normal win percentage.
With 14 pauses accounted for, this variation in the A-10 schedule appeared to have a clear impact on the final standings.
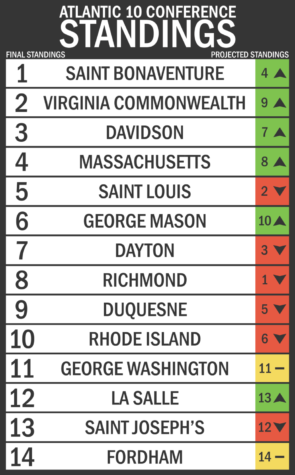
Coming into the season, Virginia Commonwealth was pegged to finish in ninth place according to the preseason media poll, while Richmond was projected to finish in first. Instead, when the dust settled on the chaotic 2020-21 A-10 schedule, it was VCU second in the standings with the Spiders sitting in eighth place.
Richmond saw its season stop twice due to cancellations, while the Rams on the other hand played through their regular season schedule unscathed.
Richmond and VCU’s unexpected finishes were part of a larger picture that showed great variation between preseason projections and final standings–even greater than expected in a traditional year.
The bottom four of the A-10 didn’t see much change from their projected finishes–all four finished somewhere between 11th and 14th. The rest of the conference, however, saw extraordinary differences between what was supposed to happen and what actually did. Teams finished an average of 4.4 spots away from where they were projected to finish.
The struggle to predict the final standings in a COVID-altered year might have been very evident, but the data seems to show that the same uncertainty manifested itself in individual games. For the most part, once teams stepped on the hardwood, basketball became basketball. Experts were about as likely to predict how a game would go as they’ve always been, even in the midst of the pandemic.
Come November, when the 2021-22 tips off, normalcy will be welcomed albeit the numbers might not change much. Fans will be in the stands, masks will hopefully no longer be needed and schedules will not fluctuate the way they had to this year. But if the numbers are any indication, 2021-22 will look a lot like the season played during the pandemic and the year before that, and the year before that.
Noah Bortle can be reached at [email protected]. Follow him on Twitter @noah_bortle.
Dan McGee can be reached at [email protected]. Follow him on Twitter @TheDanMcGee.