
In December 2013, The Washington Post’s Wonkblog named Emmanuel Saez and Thomas Piketty’s chart on income inequality the “Graph of the Year.” This chart shows the share of income captured by the top 10 percent of Americans from 1917 to 2012.
In 2012 over 50 percent of income went to 10 percent of the population; this is the highest level since 1917 and similar to those seen between 1917 and 1932.
Between 1937 and 1982, the top 10 percent’s share of income hovered around 35 percent. This corresponds with the largest economic boom ever, the creation of the largest middle class in history and the establishment of the consumer base that fuels the U.S. economy.
The 2008-2010 corporate bailouts provided hundreds of billions of taxpayer dollars in welfare. Wall Street has been railing against extensive benefits for the poor and elderly for 30 years, but when they needed welfare–far more than is provided to the poor–no questions were asked, few criticisms were made and limited restrictions made the bailouts seem like a blank check.
The political hypocrisy of the capitalist class created the Occupy protests, but economic organization is responsible for the positions of power corporate leaders possess.
A 2012 “Economist” special report focused on inequality in the U.S. and around the world. The Gini coefficient is a measurement of inequality using a zero to one scale, with zero being perfectly equal and one being perfectly unequal. According to data from the IMF and OECD, “America’s Gini for disposable income is up by almost 30 percent since 1980, to 0.39. China’s has risen by around 50 percent to 0.42 (and by some measures to 0.48).”
Scandinavian nations, with large welfare states, have the lowest Gini numbers –around 0.25. Only in Latin America, formerly the most unequal continent, have Gini numbers decreased since 1980. The report notes that a majority of people on Earth live in a nation where incomes are more unequal “than they were a generation ago.”
Yet inequality does not simply restrict the economic power of the under-compensated, it reduces political power as well. The national conversation on inequality focuses on income, but the figures for wealth are far more illuminating.
Today in the United States, 11.1 percent of all wealth is held by the top 0.01 percent of American families. In fact, 74.4 percent of all wealth is held by the top 10 percent of American families, leaving only 25.6 percent for the remaining 90 percent of people.
According to David DeGraw, wealth statistics show that, of the top one percent’s wealth ($32.6 trillion), only 0.5 percent would be necessary to eliminate poverty in the U.S. for one year. In addition, $13 trillion (or over 40 percent) of that wealth is unused, meaning it sits in savings accounts or other financial instruments.
This wealth inequality is only compounded by the growing income inequality. Year after year, the rich get richer while the other 90 percent of Americans are stuck running in place. Since 2009, 95 percent of all income growth has gone to the top 1 percent of Americans. Inequality is rising even faster than before under President Barack Obama, even if the Republicans don’t want anyone to know that.
Martin Gilens from Princeton and Benjamin Page of Northwestern University collaborated on a study exploring the political influence of American voters compared to the influence of business and special interests.
They found that the views of the public mean little or nothing to politicians. In their study, they conducted controlled tests to determine whether the views of an average American impact policymaking. They don’t. Rich individuals and business-backed interests have much more influence, and even grassroots- or membership-based interest groups have little influence compared to corporations or their rich masters.
In fact, the study goes even further, determining that the “policy preferences” of average Americans are vastly disparate from those of the political and economic elites, and that average Americans “almost always” lose.
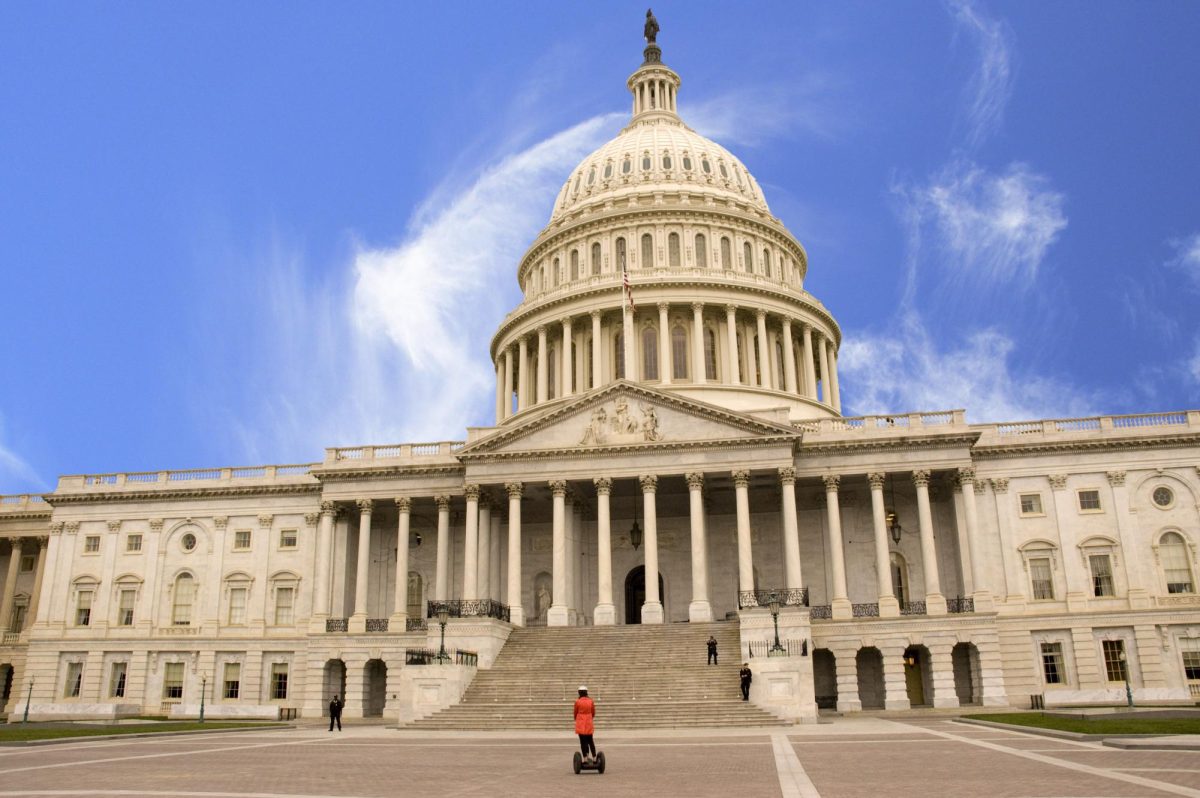
As economic power concentrates in the hands of the few, their influence on politics grows. Greater power means that Washington passes policies more favorable to the economic elite, further concentrating economic power and further diminishing the political power of the average American.
The consequence of political ignorance of the public’s policy priorities is singular: political oligarchy. After 30 years, this vicious cycle manifests daily, with broadly-supported policies, such as a higher minimum wage and increased federal background checks on all gun purchases, overturned by diametrically-opposed interests, like Wal-Mart attempting to keep wages low or Smith & Wesson trying to sell more guns.
Only serious changes to public policy can begin to roll back the concentration of political and economic power most feared by the Founding Fathers. Their fear of concentrated power led them to create a decentralized democratic republic accountable to people at a local, state and federal level. While decentralization of the federal bureaucracy would disadvantage the country on a global playing field, holding government accountable to the people is both necessary and proper.
When 10 percent of people have the power to ignore the demands of the other 90 percent, who are constitutionally entitled to nine times as much political power, democracy is broken. If we let this continue, the powerful will only entrench themselves even deeper into an oligarchy that is already difficult enough to see and even harder to destroy.
Zac Bears is the Opinion & Editorial Editor. He can be reached at [email protected].











Brenda Alvarado • Aug 30, 2016 at 11:25 pm
I believe that alot americans have felt this way for a very long time, this report is very true and to me has a lot true facts in it that not a lot of americans openly talk about. This is a big problem and if it does not change things will continue to get worse and the 90 % of americans that dont have asa much power will continue to not have a voice or opinion about anything in this country.